Inventory Expansion and Market Rebalancing
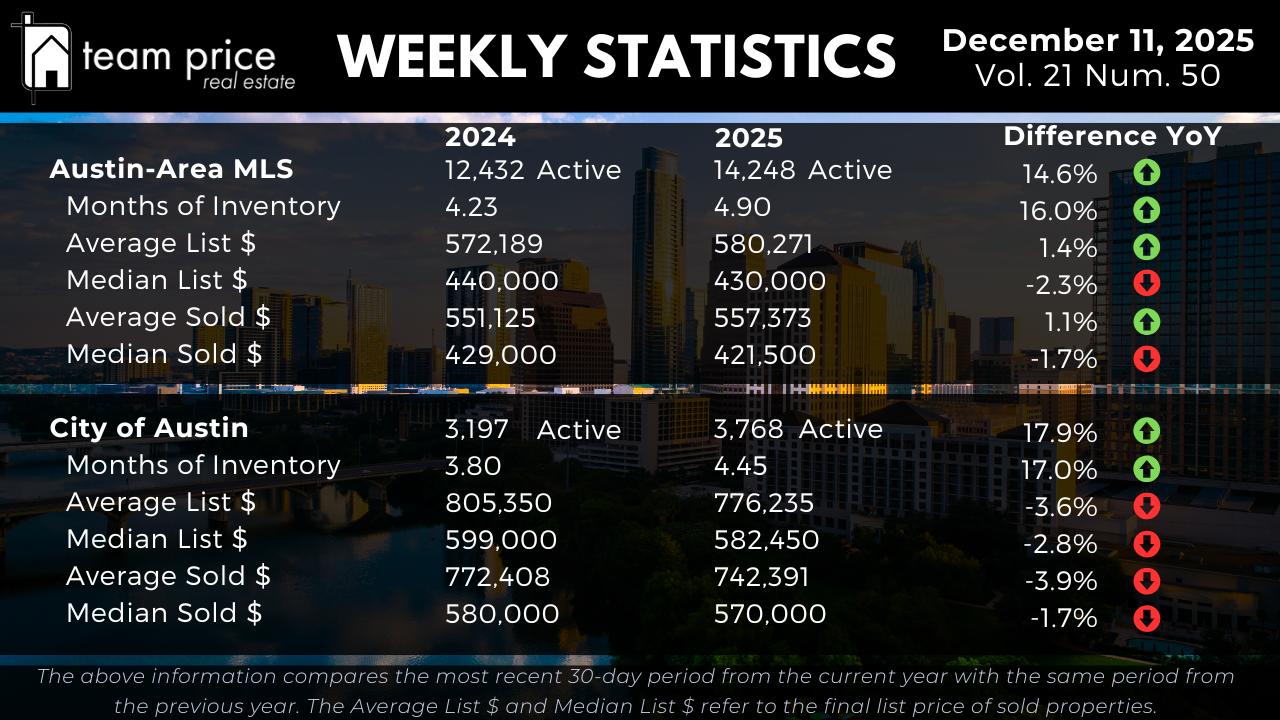
Inventory continues to expand across the Austin housing market as supply grows faster than buyers can absorb it. Active listings in the Austin-Area MLS increased from 12,432 last year to 14,248 today, a 14.6% rise. Months of Inventory increased from 4.23 to 4.90, a 16% jump that reflects a 1.2× expansion in available supply. This shift is meaningful because it tells us the market is not just experiencing seasonal fluctuation—it is absorbing a structural reset where higher inventory levels are becoming the norm. As supply continues to outpace demand, homes remain on the market longer, and buyers gain more leverage in negotiations.
Inside the City of Austin, inventory growth is even stronger. Active listings rose from 3,197 to 3,768, a 17.9% increase year over year. Months of Inventory moved from 3.80 to 4.45, rising 17%, matching the market-wide pattern almost exactly at a 1.2× expansion. Even week over week, the upward pressure in supply remains steady, reinforcing the long-term trend rather than showing any signs of easing. Both the city and the surrounding suburbs are clearly moving together: more listings, slower turnover, and a market that is transitioning out of its correction phase into a more balanced environment.
Nothing about this shift appears temporary. Expanded inventory is now a defining feature of the market, not a short-term surge. Buyers benefit from more choices, more negotiation room, and less urgency. Sellers must adjust by pricing with precision and preparing homes thoughtfully. Strategies that relied on momentum or rapid absorption no longer fit today’s conditions, and the market increasingly rewards accuracy over optimism.
Pricing Trends and Market Direction
Prices across the Austin-Area MLS remain stable but flat. The average active list price increased slightly from $572,189 to $580,271, up 1.4% year over year. The median active list price fell from $440,000 to $430,000, a -2.3% change, showing the market is leaning toward mid-priced inventory and not being supported by a surge of high-end listings. That gap between the average and median is important. It signals a pricing environment that is steady overall but still recalibrating underneath the surface.
Sales prices tell a similar story. The average sold price moved from $551,125 to $557,373, up 1.1% year over year. The median sold price declined from $429,000 to $421,500, down -1.7%. Week over week, pricing has held steady, which reinforces the idea that values are not in a freefall but have shifted into a phase of slower, controlled movement. Buyers remain more price sensitive than in prior years, and properly priced homes are still selling on schedule.
Inside the City of Austin, price adjustments are more noticeable. The average active list price declined from $805,350 to $776,235, down -3.6%. The median active list price declined from $599,000 to $582,450, a -2.8% shift. Sales pricing mirrors this. The average sold price moved from $772,408 to $742,391, down -3.9% year over year. The median sold price decreased from $580,000 to $570,000, a -1.7% decline.
Directionally, none of this points toward appreciation. Instead, it shows a market that has corrected, stabilized, and is now adjusting in small, predictable movements. Buyers are value-focused, and sellers who price at market—rather than ahead of it—see the cleanest results. This environment rewards discipline, not speed.
Negotiation Environment and Buyer Leverage
Negotiation patterns continue to favor buyers across the Austin-Area MLS. So far this month, 71.74% of all sold properties have closed below list price, up from 69.03% last month. Another 17.36% sold at asking price, compared with 19.21% last month. Properties that sold above the list price accounted for 10.91% of closings, slightly lower than last month’s 11.76% but higher than the 10.24% posted in December 2024. Even with small weekly fluctuations, the broader trend shows that buyers still control the negotiation environment.
The average sold-to-list price ratio stands at 96.69%, meaning sellers are conceding roughly 3% on average. This ratio has held stable for several weeks, suggesting the market has found its footing. Sellers who enter the market with accurate pricing can still secure clean offers without heavy concessions. Those who overshoot the market typically face longer days on market and end up needing price reductions to re-engage buyers.
In this phase of the market, precision is the competitive advantage. Buyers benefit from expanded selection and reduced urgency, while sellers win when their pricing is realistic and aligned with comparable sales, not aspirational benchmarks from earlier cycles.
Regional & ZIP Code Performance
Market performance across Central Texas is balanced but slightly leaning toward softening. Month over month, 11 of 30 tracked cities (37%) posted price increases, while 16 cities (53%) saw declines. Year over year, 12 cities (40%) are up, and 18 (60%) are down. These ratios confirm a market that is not moving in a single direction but is instead adjusting based on hyperlocal factors such as affordability, school districts, product type, and neighborhood maturity.
Relative to each city’s 12-month peak, the trend is even clearer: zero cities remain above their recent peak, and 29 have declined from peak values. That reinforces the narrative that the correction phase is complete, and markets have settled into a post-peak stability.
Across 75 ZIP codes, 34 (45%) posted month-over-month increases and 38 (51%) saw declines. Year over year, 38 ZIP codes (51%) show price gains and 37 (49%) show declines. Only four ZIP codes remain above their 12-month peak, while 71 are below, mirroring the same stabilization pattern observed at the city level. The regional story is no longer decline. It is equilibrium. Prices are holding within predictable ranges, and the volatility of the correction period has eased.
Prices Relative to Peak Levels
Relative to peak performance, the Austin housing market has fully corrected and is operating within a stable range. In the Austin-Area MLS, the median sold price remains 16.7% below the May 2022 peak, and the average sold price is 9.2% below its peak. Price per square foot shows deeper change, with the average down 18.2% and the median down 22.5%. These numbers reinforce the long-term trend: pricing has reset to sustainable levels and is no longer in a declining pattern.
Inside the City of Austin, the pullback follows the same logic. The median sold price is 9.6% below its May 2022 peak, while the average sold price sits 3.6% below peak. Price per square foot ranges between 18% and 20% below the high-water mark depending on the measure used. These declines are not signs of instability—they are signs that the correction is behind us.
Market Outlook
As we move through 2025, the Austin housing market is entering a predictable and steady phase after several years of correction and adjustment. Inventory continues to expand at double-digit rates, yet pricing remains stable and well-supported at current levels. Over-ask activity remains limited, and the buyers who win homes today are doing so through strong alignment rather than aggressive bidding.
The outlook is consistent and clear. Buyers retain leverage through increased choice and reduced urgency. Sellers succeed when they offer accurate pricing, strong presentation, and realistic expectations. The market is no longer driven by momentum; it is driven by value. Austin has transitioned from volatility into balance, setting the stage for a steadier 2026 where both buyers and sellers can plan with confidence.