Weekly Austin Real Estate Market Update
Austin Real Estate Weekly Market Update - July 03, 2025
by: Dan Price, Broker at Team Price Real Estate
Austin's leading data analysis brokerage, where data drives exceptional service
Published on: Thursday, July 03, 2025 at 07:59 am
Austin’s Real Estate Market : The Austin housing market is steadily shifting as elevated inventory levels continue to reshape conditions across the region. The latest figures from Team Price Real Estate show active residential listings across the Austin-Area MLS have climbed to 17,679—a 9.6% increase compared to this time last year. Months of Inventory has expanded to 6.39, marking a 16.0% rise year over year. These numbers reflect a market where buyers now face fewer bidding wars and more choices, particularly for resale properties.
Pricing trends are showing a market that remains sensitive to these supply pressures. The median sold price across the Austin area is now $435,000, down 1.1% from last year, while the average sold price has edged up to $572,571, a 1.7% year-over-year increase. This pattern highlights the split nature of the market—stronger performance at the upper price points is helping to hold average prices steady, while softer conditions persist in the middle price ranges where affordability remains a key concern for buyers.
In the City of Austin specifically, the supply trend is even more pronounced. Active listings have increased by 14.2%, reaching 5,701 homes on the market. Months of Inventory has risen to 6.97, reinforcing the transition toward a neutral-to-buyer-leaning environment. Median sold prices within city limits have fallen to $586,500, reflecting a 2.2% annual decline, while the average sold price has improved to $783,103, a 2.1% gain year over year. The top end of the market continues to show resilience, but downward price pressure is clearly visible for homes priced near the $600,000 mark—a key affordability threshold for many buyers.
Overall, today’s market presents a dynamic landscape. Buyers are benefiting from greater selection, more room for negotiation, and fewer pricing escalations. Sellers, meanwhile, must approach pricing with precision and be prepared to compete for buyer attention. Whether buying, selling, or investing, understanding these evolving market forces is critical. For detailed, hyperlocal insights by city, neighborhood, and zip code, download our latest comprehensive market report packed with current data and expert analysis for the entire Austin region.

Austin Real Estate Market Overview
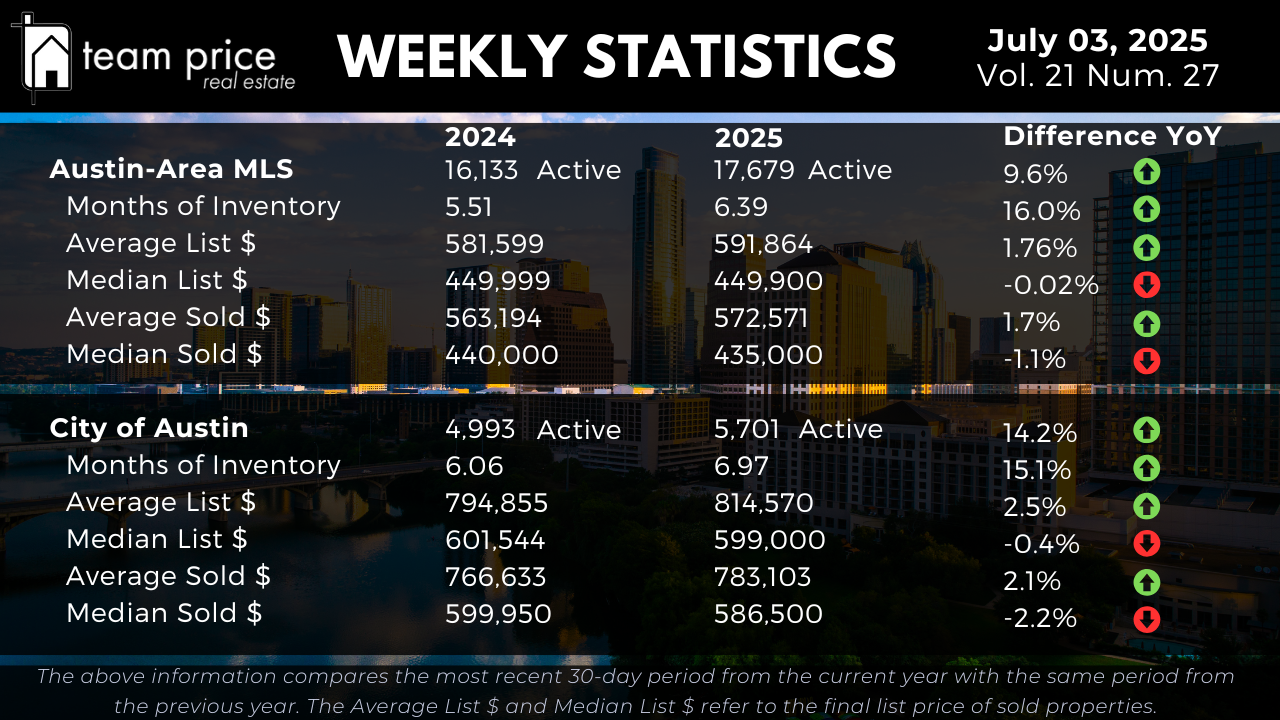
Inventory levels across the Austin-Area MLS continue their steady upward climb, signaling that the region remains firmly in a market transition phase. As of this week, there are 17,679 active residential listings on the market, up 9.6% from the same period last year. Months of Inventory has expanded to 6.39, a 16.0% year-over-year increase that reflects the consistent buildup of supply and a more deliberate pace of buyer activity. Within the City of Austin, these inventory trends are even more evident. Active listings have increased by 14.2%, rising from 4,993 to 5,701 homes. Months of Inventory has grown from 6.06 to 6.97, a 15.1% rise that further confirms the growing leverage available to buyers as sellers adjust expectations. The region’s supply trends suggest sellers face increased competition, while buyers enjoy more options, greater negotiating room, and fewer bidding wars compared to recent years.
Austin Housing Prices: Stability with Pockets of Softness
The latest pricing data reflects a market in a delicate balancing act between buyer caution and seller confidence. Across the Austin-Area MLS, the average list price for active homes now sits at $591,864, a modest 1.76% increase compared to last year. The median list price remains virtually unchanged, down just 0.02% to $449,900. On the sales side, average sold prices have ticked up by 1.7% year over year to $572,571, while the median sold price has softened slightly, declining 1.1% to $435,000. This dynamic suggests that while upper-tier properties are helping to buoy average prices, middle-market and entry-level segments are experiencing pricing pressure as affordability remains top of mind for many buyers.
Within Austin city limits, the market shows a similar but more pronounced divide. The average list price has increased 2.5% year over year to $814,570, highlighting continued strength in the luxury and higher-end segments. Conversely, the median list price has dipped 0.4% to $599,000, pointing to increased price sensitivity and competition among mid-range homes. Average sold prices in Austin are up 2.1% to $783,103, yet median sold prices have fallen 2.2% to $586,500. These figures underscore a familiar theme: while well-located, higher-end properties retain buyer attention, affordability challenges and inventory growth continue to weigh on broader pricing, particularly for homes in the $500,000 to $600,000 range.
Regional Trends: Correction Persists Across Central Texas
Across the 30 cities tracked in Central Texas, market conditions remain mixed, with no clear signs of sustained price recovery. Half of those cities—15 out of 30—posted month-over-month price increases, while the other half experienced declines. The longer-term view, however, reveals broader weakness. Just 37% of cities recorded year-over-year price gains, while 63% saw prices fall. Notably, none of these cities remain above their pricing peak from the past 12 months, reflecting the continued, region-wide market correction.
A similar pattern is playing out at the ZIP code level. Of the 75 ZIP codes monitored, 45% posted month-over-month price increases, while 53% experienced declines. On a year-over-year basis, only 37% of ZIP codes have seen price growth, with the remaining 63% reflecting price declines. Just one ZIP code across the region remains above its 12-month pricing peak, further confirming that the correction remains broad-based, despite isolated signs of monthly improvement in some submarkets.
List-to-Sale Price Performance: Negotiation Remains the Norm
Price negotiations continue to define the current market environment. So far this month, 65.71% of all homes sold in the Austin-area MLS closed below their original list price, a slight increase from last month’s 62.80% and notably higher than the 63.42% recorded this time last year. An additional 21.87% of sales closed precisely at list price, while only 12.43% of properties sold above asking—a decline from both last month and June of 2024. The average sold-to-list price ratio now stands at 97.27%, reinforcing that while many homes are still trading near asking price, the majority of sellers are making modest concessions to secure buyers. Homes priced appropriately and marketed effectively continue to draw interest, but buyers are increasingly strategic and selective, particularly in the face of expanding inventory.
Peak Value Trends: Market Remains Well Below Previous Highs
Despite relative stability over the past few months, the broader Austin housing market remains well below its previous peak pricing. In the Austin-Area MLS, the average list price peaked at $715,542 in April 2025 and has since declined to $657,192, marking an 8.2% drop. The median list price is down 12.0% from its May 2022 peak of $539,900 to $475,000. Similarly, the average sold price has fallen 13.7% from its May 2022 high of $664,515 to $573,723, while the median sold price has retreated nearly 20%, dropping from $538,000 to $431,000. Price per square foot figures reflect comparable declines, with averages down over 20% from their peaks.
The City of Austin has followed the same trajectory. The average list price, once as high as $949,938 in April 2025, now stands at $834,581, a 12.1% decrease. The median list price has fallen 12.3% from $661,250 to $579,950. The average sold price has slipped 7.1% from its $847,583 peak to $787,052, while the median sold price is down 13.8% to $586,000. Price per square foot declines in Austin have also been significant, with the median figure down more than 20% from its peak of $393 to $311. These figures confirm that while some pricing stability has returned, the broader market remains well below its highs from 2022 and early 2025, signaling an extended correction cycle that continues to shape buyer and seller expectations alike.
Austin Area Residential Sales Insights
Austin Housing Market Top Questions and Answers : July 03, 2025
Is the Austin housing market still correcting, or has it stabilized?
The Austin housing market remains in the midst of an extended correction cycle, despite some signs of stabilization in recent months. While average sold prices have seen modest year-over-year gains—up 1.7% across the Austin-Area MLS and 2.1% within the City of Austin—the broader market remains well below its peak values from 2022 and early 2025. For example, the median sold price in the Austin-Area MLS has declined nearly 20% from its May 2022 high, while in the city limits, the median sold price is down almost 14% from peak. Additionally, price per square foot metrics are still off by more than 20% from their highs. These declines indicate that while sharp price drops have slowed, the market continues to adjust, and full price recovery remains a long-term process rather than a short-term bounce.
Are buyers gaining more negotiating power in the Austin market?
Yes, buyers continue to gain leverage as inventory levels rise and competition among sellers intensifies. Active residential listings across the Austin-Area MLS have increased by 9.6% year over year, with Months of Inventory now at 6.39—a 16.0% increase compared to last year. Within the City of Austin, active listings have climbed 14.2%, and Months of Inventory has reached 6.97. This level of supply growth gives buyers more options and greater negotiating room. So far this month, nearly 66% of all homes sold below list price, while only about 12% sold above asking, reinforcing that sellers are making concessions in many transactions. The current average sold-to-list price ratio of 97.27% reflects these dynamics, with buyers able to secure properties below asking in a majority of cases.
How does pricing differ between the broader Austin-Area MLS and the City of Austin?
The pricing trends within the City of Austin show a more segmented and uneven market compared to the broader region. For active listings, the average price within city limits has increased by 2.5% year over year to $814,570, signaling continued demand and strength at the higher end of the market. Meanwhile, the median list price has declined by 0.4% to $599,000, highlighting increased competition and price sensitivity among mid-range and entry-level homes. On the sold side, average prices in Austin have climbed 2.1% to $783,103, yet the median sold price has fallen 2.2% to $586,500. This divergence underscores the fact that while higher-end, well-located properties continue to attract buyer interest, affordability challenges and inventory growth are applying downward pressure to the middle and lower price segments.
Are prices in Austin still below their peak levels?
Yes, across all major pricing metrics, both the Austin-Area MLS and the City of Austin remain significantly below their peak values. In the Austin-Area MLS, the median sold price has declined nearly 20% from its May 2022 peak, and price per square foot metrics are also down over 20%. Within the city, median sold prices have fallen nearly 14% from peak, and price per square foot is down more than 20% as well. Even average sold prices, which have held up better due to strength at the upper end of the market, remain below their highs. These declines are consistent with a broad market correction that has been underway for nearly two years, and while isolated signs of stabilization are emerging, the data makes clear that prices are still operating well below their recent highs.
What do the regional trends across Central Texas say about the broader market?
The regional data shows that the market correction extends beyond Austin proper and remains broad-based across Central Texas. Of the 30 cities tracked, half experienced month-over-month price increases, but only 37% saw year-over-year gains, with the majority still posting price declines. At the ZIP code level, just 37% of areas posted year-over-year price increases, while 63% saw declines. Notably, none of the 30 cities and only one ZIP code remain above their 12-month price peaks. This data confirms that while there are isolated pockets showing monthly improvement, the overall regional market continues to feel the effects of a widespread price correction, with no city or submarket fully regaining previous peak pricing levels.